Brent Nears $110 on Hormuz Supply Risks

While Iran has reportedly presented a new proposal to the United States aimed at reopening the Strait of Hormuz—prioritizing the lifting of the naval blockade and postponing nuclear negotiations to a later stage, according to Axios—and the US Navy has allegedly seized $380 million worth of Iranian crude oil in the Indian Ocean, Brent prices have resumed a sharp upward move over recent sessions.
The premium over WTI has returned to more typical levels, turning positive again after briefly trading at a discount—an unusual occurrence for Brent relative to US crude. It currently stands at +$8.98 (WTI $97.94, Brent $106.92 on our platform), which still appears elevated compared to pre-Hormuz crisis norms.
Despite broader optimism in equity markets, the oil market has remained under significant stress for nearly two months. Production is estimated to have declined by close to 12 million barrels per day, excluding transportation disruptions, while demand is also beginning to show signs of contraction. According to the IEA, demand destruction may already be approaching 2.5 million barrels per day globally.
If this situation persists, the impact on key sectors could be substantial. Industries such as aerospace and tourism would likely be among the first affected, followed by real estate, which could face pressure from both higher interest rates and reduced mobility. However, this extends beyond the immediate scope of this analysis.
Brent has risen from Friday, the 17th’s low of $87.25 to approximately $106.80, representing a gain of 22.35%.
TECHNICAL ANALYSIS
We focus on the range between $87.25 and $114.45, within which Brent has traded on our platform since March 9, aside from brief upward spikes in the initial phase. On this 4-hour chart, we do not attempt to project extended upside targets, although it is worth noting that Brent traded above $147 during the 2008 commodities cycle peak.
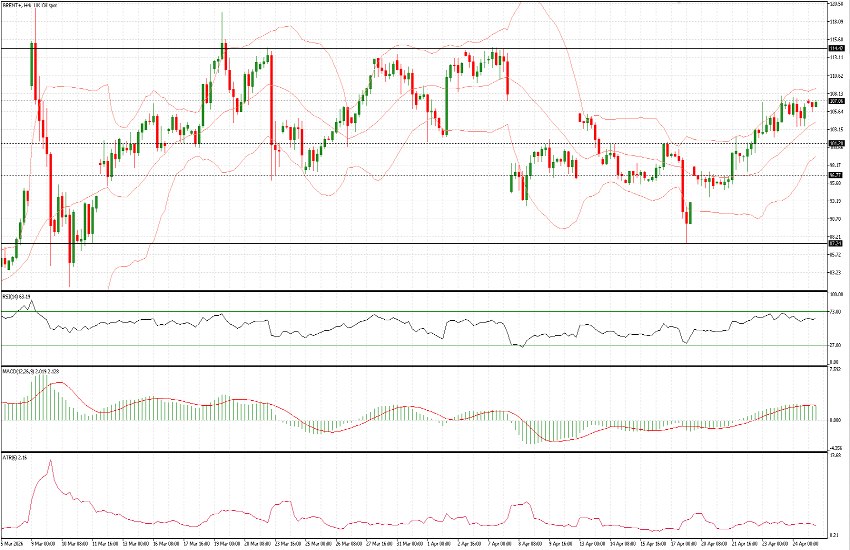
Price is once again testing a key resistance area, which also coincides with the April 8 gap-down opening level. Indicators on the 4-hour chart suggest continued strength, with room for further upside, while Bollinger Bands point toward a potential breakout above approximately $107.05.
Should this level be cleared, a move toward $114.40 appears plausible, with an intermediate resistance zone near $110.
Volatility remains elevated, with the ATR (6) indicating an average move of $2.16 every 4 hours. In this context, a spread trade versus WTI may offer a more balanced risk approach, as the relative pricing dynamics between the two benchmarks continue to show signs of stability.